
(7-minute read)
The economy and the stock markets have disconnected. Economic growth is almost as bad as it has ever been.
Conversely the stock market is nearly as expensive as it has ever been.
Some want to reconcile the two. Others don’t care. Where you sit is a good indicator of an investor versus a trader.
And that will matter when you decide what to do from here.
The Tech Boom Test
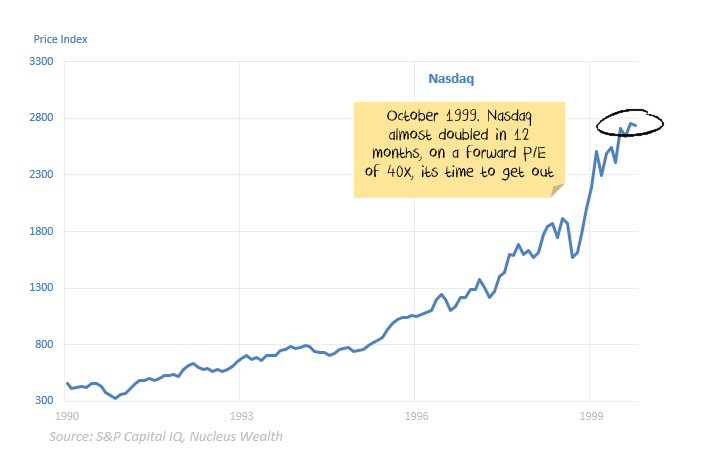
It is June 1999. The NASDAQ index (measuring a group of US tech stocks) is at 2,500 on close to record valuations.
You decide it is a bubble, and make the decision to sell most of your stocks and wait for sanity to return.
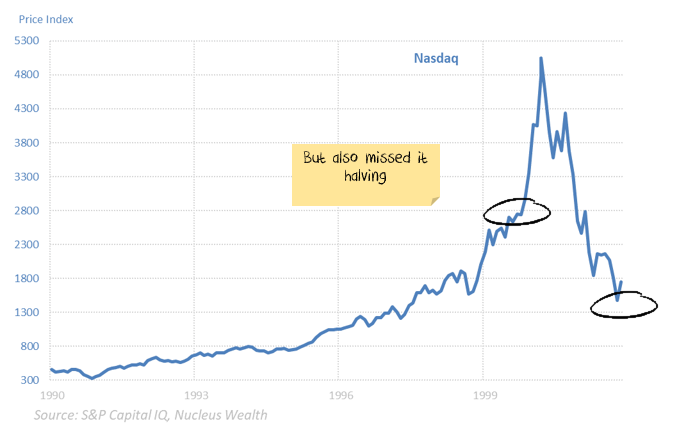
After three years, the NASDAQ is 50% lower at 1,250. Your assessment is vindicated.
However, before it fell to 1,250 the NASDAQ first rose to almost 5,000. Were you right or wrong to sell?
An investor will say you were right, you assessed the situation, made a call and were vindicated.
However, before it fell to 1,250 the NASDAQ first rose to almost 5,000. Were you right or wrong to sell?
An investor will say you were right, you assessed the situation, made a call and were vindicated.
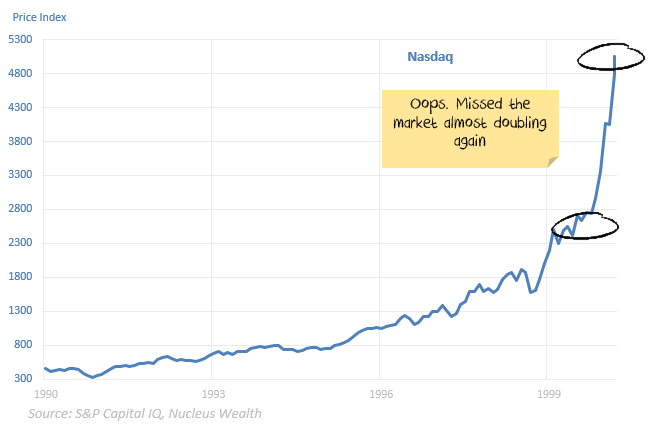
A trader would say that you made the wrong decision. You could have doubled your money if you held on for longer. There was plenty of time to sell.
The Difference Between Traders And Investors
For a professional trader, making money is the primary goal. If there is a bubble, the trader’s goal is to ride the bubble all the way up and then short it all the way down.
Buying or selling based on a non-specific “reading” of the market is fine, as long as you continue to be right.
For a professional investor, repeatable returns are the goal.
Asset consultants (who give these investors funds to invest) are interested in seeing that the investor has a process that they follow.
Asset consultants want to see that the fear and greed that the market offers on a daily basis aren’t affecting their returns.
If you are a trader, you have reasons to keep chasing the market higher. If you are an investor, it is going to be much harder to justify.
What Will Pop the Bubble?
All bubbles are built on a grain of truth.
That truth here is that central banks and governments “have your back” and will buy anything and everything to keep the stock market high.
I think central banks will continue to bail out corporate debt markets where they can. But already we are seeing cracks with Hertz and several airlines filing for bankruptcy.
The more significant issue is small and medium businesses which (a) make up 50-70% of most economies; and (b) don’t have traded debt that central banks can buy.
But the true demise is probably not going to be until the irrationality of the earnings is acknowledged.
My best guess is a mix of bankruptcies and continued weak earnings will eventually do it.
A Biden win in the US election, or even the increased threat of one, could also shock the market into a dose of reality with the spectre of higher taxes and wages damaging profits.
How Much Bigger Can This Bubble Get?
Bubbles rely on new money to keep them inflated or growing. So, as long as new money is flowing, the stock market bubble can keep growing.
There are four primary sources bubbles rely on for new money:
1. New Investors
Globally there has been a rush of new, generally younger, investors into the market.
During the COVID-lockdown, 75,000 New Zealand investors joined Sharesies and the number of members at Hatch, which enables investment in US stocks, doubled.
Robinhood, a popular new US trading platform, has three million accounts this year.
If you take the top four US online brokers, we can find another three million accounts in the first quarter alone.
Australia, at less than a tenth of the size of the US, in six weeks added 280 thousand new and reactivated accounts.
UK firms are reporting up to 300% more new accounts in the first three months. It is a global phenomenon.
But these numbers need context.
The tech boom in 2000 was also (in part) driven by new retail accounts, peaking at around 19 million US households with at least one trading account (noting a different definition of accounts) in 2001.
That fell to 17 million a few years later, where it has remained since.
If we assume nine million new US accounts this year, and 65% already had a household account = three million new households with accounts.
That would put household accounts above the dot-com boom peak.
Two conclusions: (a) the numbers are significant; and (b) we have probably seen most of the increase in accounts already.
2. Increased Gearing
Many booms involve a significant increase in debt to fuel asset price growth.
Given the speed of the market rise, and the number of new accounts, it seems unlikely increased gearing has played a meaningful role in the boom.
3. Derivatives
Gearing doesn’t just have to be through debt.
The other way to get leverage is through derivatives which can increase the return (and the risk) by many multiples of the investment.
While the investors themselves might not be buying the stock, the market makers who are selling the derivatives need to purchase the shares to hedge against losses.
Derivative trading has increased substantially. Especially among retail investors.
4. Switching Asset Classes
The final way to get more money into a stock market bubble is to transfer money from other asset classes. This comes in two parts:
(1) Central banks: Central banks are encouraging stock investment. By buying government debt, they are hoping to force investors to shuffle up the risk spectrum.
Having said that, governments are also issuing massive amounts of debt.
So, to get investors to switch into equities, central banks need to buy more debt than what governments are issuing — otherwise the opposite will happen.
In context, the US government had about $23 trillion of debt at the start of the year, and $25 trillion at the beginning of May.
Over the same timeframe, the US Federal Reserve assets rose from $4 trillion to $7 trillion.
US debt will probably increase by about another $4 trillion in 2020. So, if the US Federal Reserve does not also increase its balance sheet by $4 trillion, then money will flow into government bonds from other assets.
Also, corporate debt is rising on the back of lost sales. So, going forward, the Fed will need to increase its balance sheet enough to cover all of the government debt and all of the new corporate debt.
Then, repeat this problem in just about every country globally. Otherwise, money won’t keep flowing into the stock market.
(2) Investors: According to the latest Bank of America survey, fund managers agree that the stock market is overvalued:
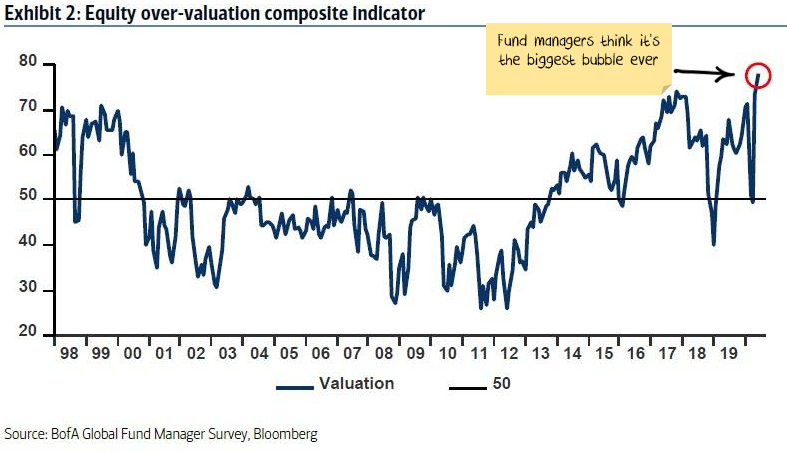
And in April they acted that way, selling stocks. But not in May. Fear of Missing Out (FOMO) took over, and they were buying stocks:
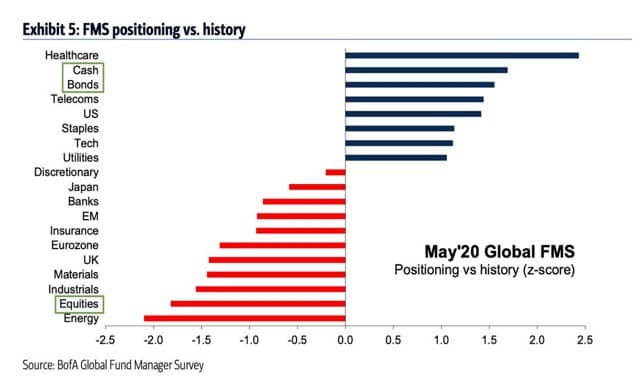
Hedge funds now have one of their highest ever weighting to the stock market — which suggests they are unlikely to buy much more.
Taking Stock of the New Money
Where does that leave us?
• There are probably not that many new retail investors to add to the stock market.
• There is scope to increase margin lending, but no signs of that occurring.
• Derivative use is already very high, and probably can’t grow too much more.
• Hedge funds (in aggregate) are a lot closer to their maximum equity exposure than their minimum. So, there is not much more buying to come there.
• Fund managers (in aggregate) talk a good game about over- valuation but are actually relatively fully invested and so don’t have a lot of scope to buy more equities.
• Central banks are going to have to run hard just to keep up with government and corporate bond issuance. It is possible central banks do more. They are the bull’s best hope for an extended bubble.
The US tech boom took about two years to play out, but was a different type of bubble. The China 2015 Bubble took four months before economic reality sunk in.
The Closest Bubble?
The closest analogy to the current one is probably the 2015 Chinese stock bubble.
The Shanghai Composite Index rose 60%+ over from February to June 2015. It then crashed back to prior levels over the next three months.
The growth was driven by a similar (15-20%) increase in retail trading accounts, as we have seen in the US. The narrative was faith in the government and central bank. The end was weak economic data.
The differences are that there was far more margin lending in the China stock bubble, but greater use of derivatives in the virus bubble.
The End Game
I expect the virus bubble will be closer in time frame to the China bubble than to the dot-com bubble. But bubbles often last longer than seems reasonable.
If you are a trader, there may well be scope to try and run in front of the thundering herd for a bit longer.
As an investor, I can understand the bubble may get bigger before it pops. But the downside seems more certain than the upside.
Source: Damien Klassen, Nucleus Wealth Management.
What do you think about it? Tag me on your favourite social media (Facebook / Instagram / LinkedIn / Twitter).
P.S. I research and interview economists, NZ investors and profitable companies to find tools & tactics that you can use to achieve financial freedom.
➔ Join my private newsletter to be the first one to learn insider tips! Here are examples of what you’ll get. It’s FREE. You can unsubscribe at any time. I treat your email as my top secret.
IMPORTANT: This article is of general nature only and readers should obtain advice specific to their circumstances from professional advisers.