(5-minute read)
House prices relative to incomes is not a perfect measure of housing affordability, because it does not take into account the fact that structural declines in mortgage rates have provided an offset by reducing debt-servicing costs.
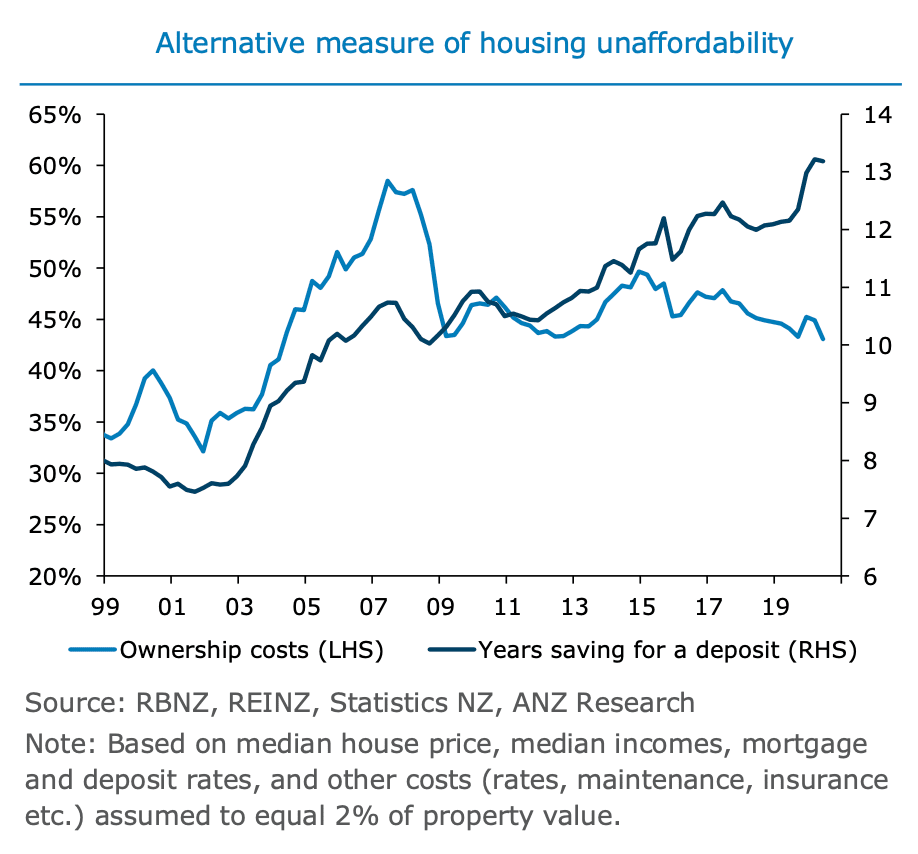
We consider two alternative measures, which we view as more representative of housing affordability.
- Ownership costs relative to incomes, for those purchasing their first home; and
- Costs of saving for a deposit while renting relative to incomes, for those who are trying to get onto the property ladder.
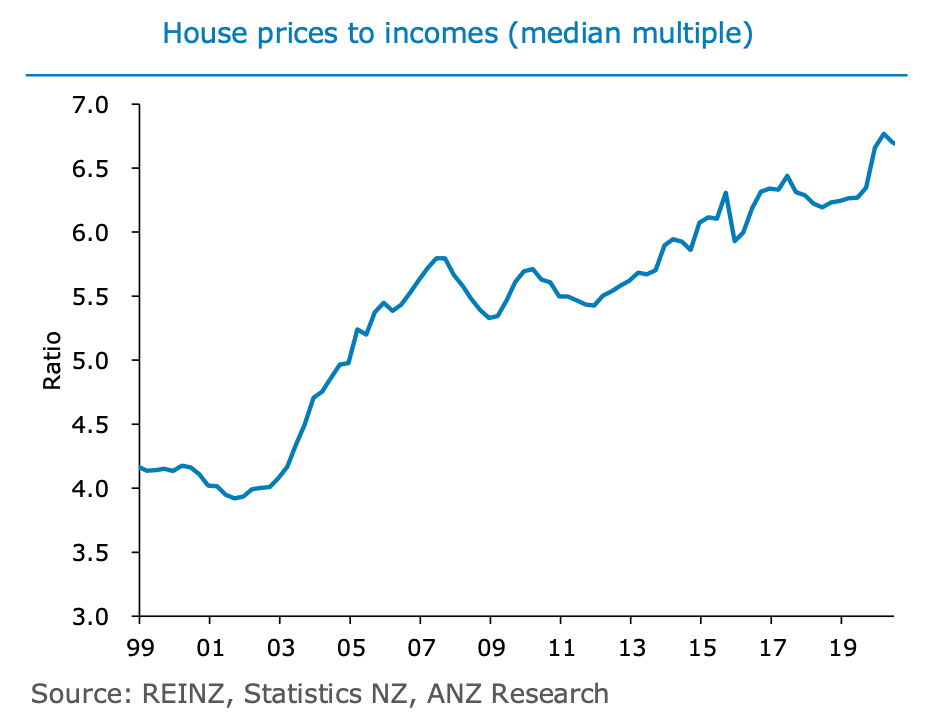
These measures are illustrative, based on median housing values and incomes. In reality, costs will depend on personal circumstances and the particular house one buys or rents.
For example, most purchasers choose a lower-value property as their first step on the property ladder, but the same trends will Hold.
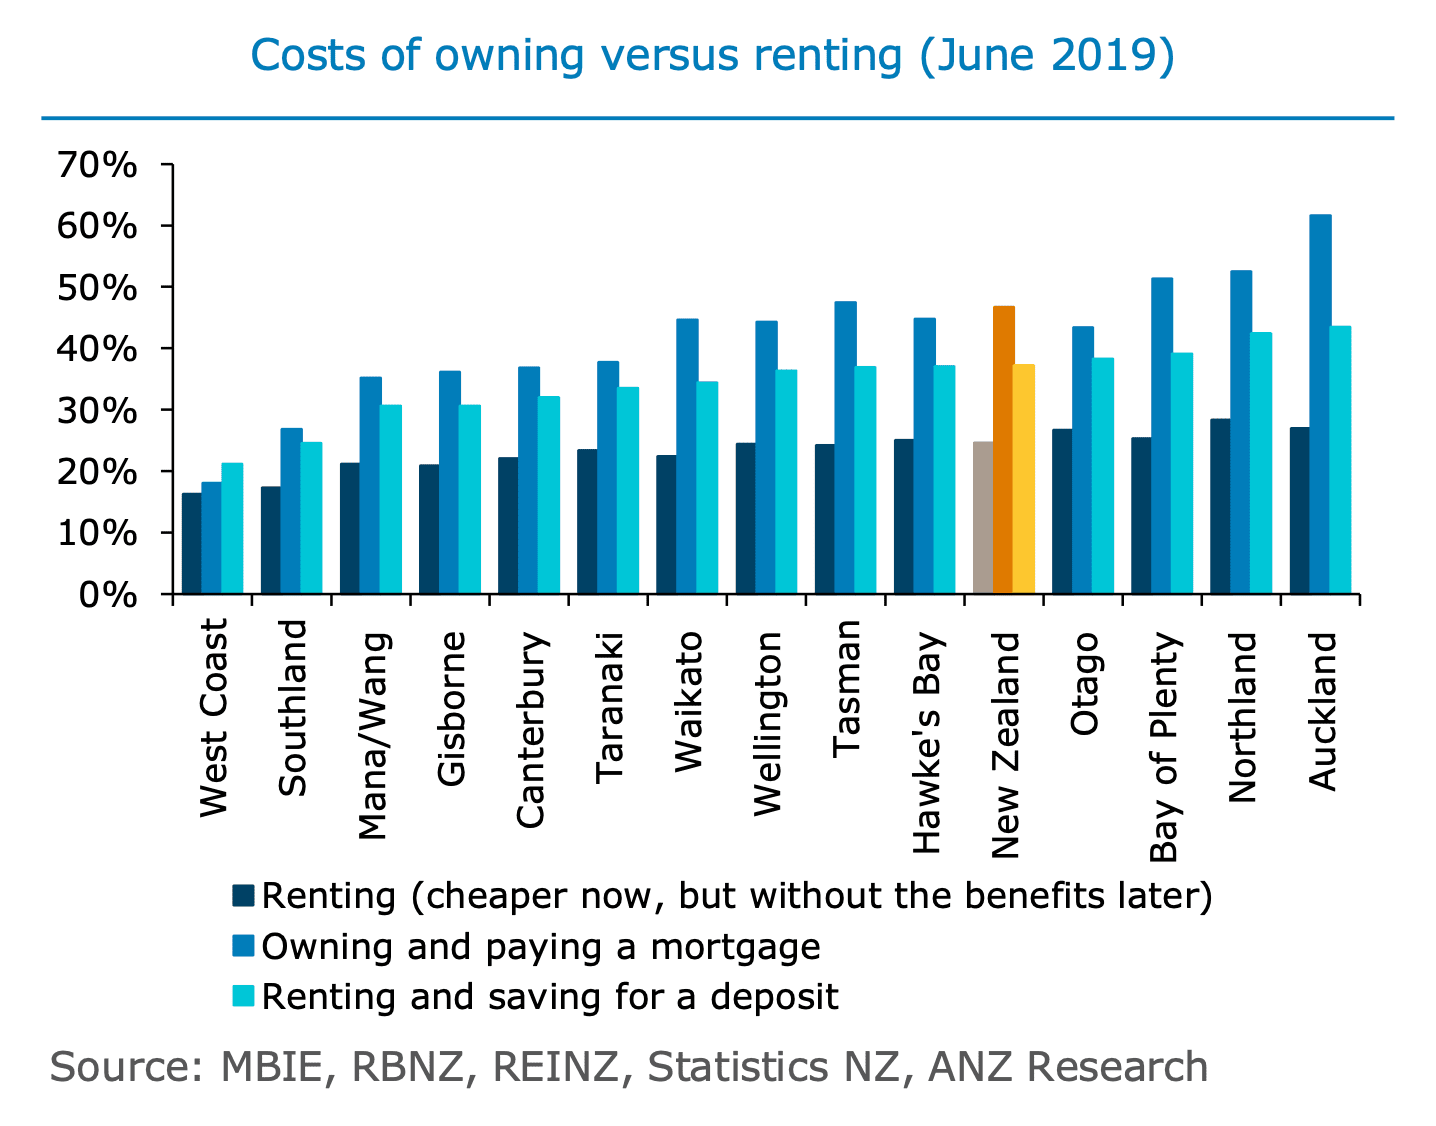
Based on these measures, houses are expensive and have become more so. Since the late 1990s, ownership costs have increased from about 35% of household incomes to around 45%, and the time taken to save for a deposit (assuming one is saving 10% of pre-tax income) has extended from 8 to almost 14 years.
On a like-for-like basis, purchasing a new home costs about twice as much as renting.
Weighing up the decision to rent or buy is very situation dependent and is contingent on personal circumstances, costs, preferences, income expectations, taxes, expectations of capital gains, and other perceived benefits.
But for those who do own their own homes, the benefits can be very substantial, including security of tenure and eventual freehold status, especially valuable in retirement.
There will always be some who cannot afford to purchase a house to secure these benefits, and the cohort of people who are able and willing to do so has reduced as houses have become more expensive.
The rate of home ownership has fallen from 74% in the early 90s to 65% in 2013.
Costs of home ownership can be a significant constraint on housing affordability even with interest rates extremely low.
This is because house prices, and by extension debt levels, are very high.
Secular declines in mortgage rates have been more than offset by rising house prices over the past few decades.
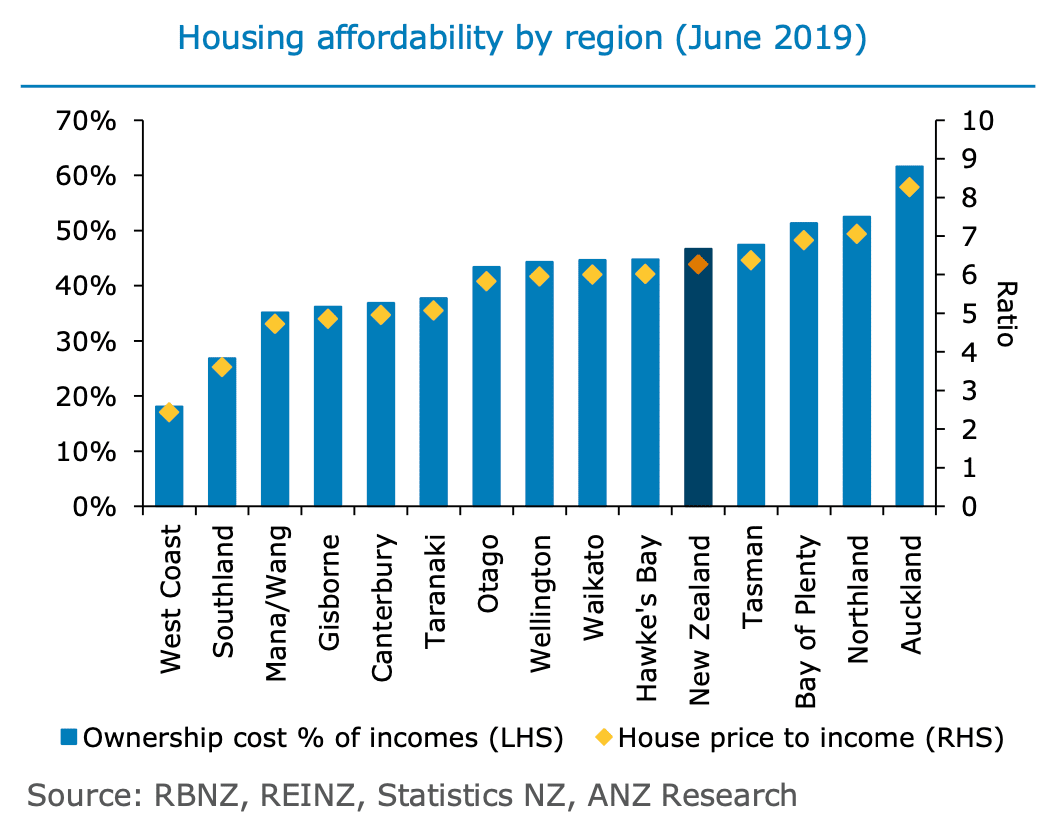
Houses are expensive across most New Zealand regions, with home ownership costs comprising more than 40% of incomes in 8 out of 14 regions, and more than 60% in Auckland.
For those looking to get onto the property ladder, saving and renting concurrently on average eats up about 37% of incomes in New Zealand as a whole, and as much as 43% in Auckland.
High house prices in regions like Auckland reflect the desirability of living there and also that population growth tends to be strong, with the region getting a significant portion of new migrants.
In general, people (including those with a high willingness to pay) will pay a premium to live in vibrant centres, with amenities, good weather, natural capital, good infrastructure, plentiful jobs, and growth potential.
To some extent, the population can adjust to high housing costs, with people gravitating to areas where housing is cheaper, and this does occur to some degree, but it is limited.
Generally, people will move to where the jobs are.
When houses in Auckland get more expensive, people may move to Hamilton and Tauranga, but Southland is a less obvious substitute.
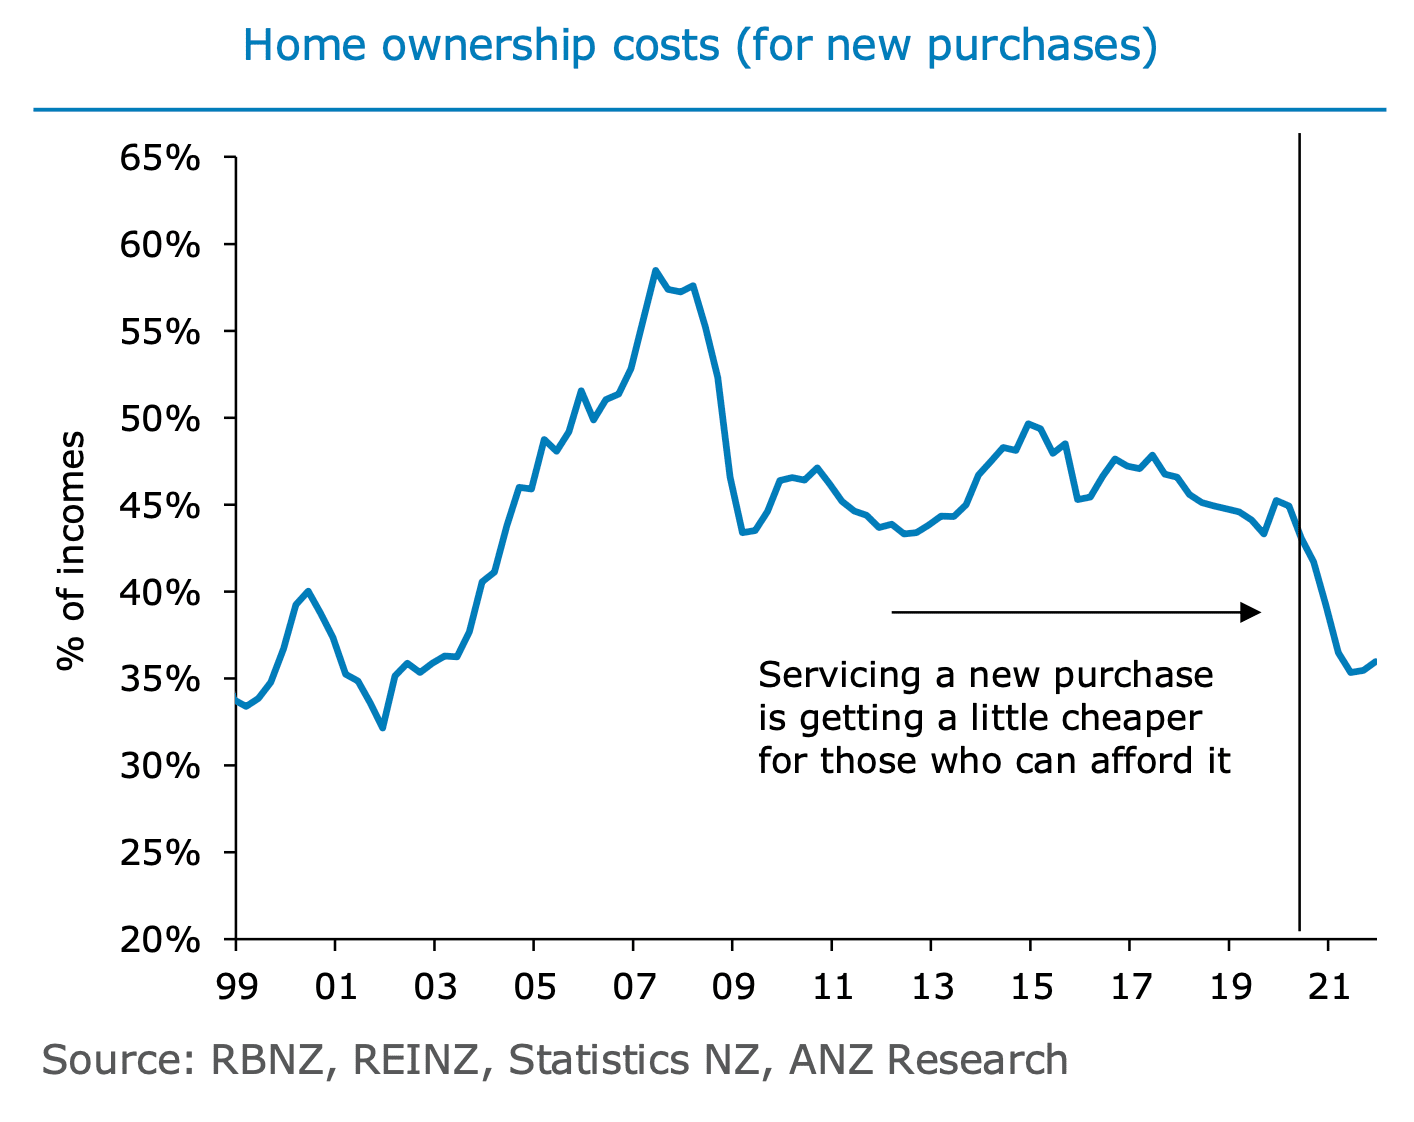
As minimum mortgage rates have fallen, home ownership costs for those entering the market have eased a little to 43% of incomes (figure 6), with incomes also coming under pressure recently.
We expect home ownership costs will decline further, to perhaps 35% of incomes, as mortgage rates fall further, with weakness in house prices dampening costs for new purchases too, but weaker incomes providing an offset.
Auckland Property Prices Climb by 8% Year-On-Year
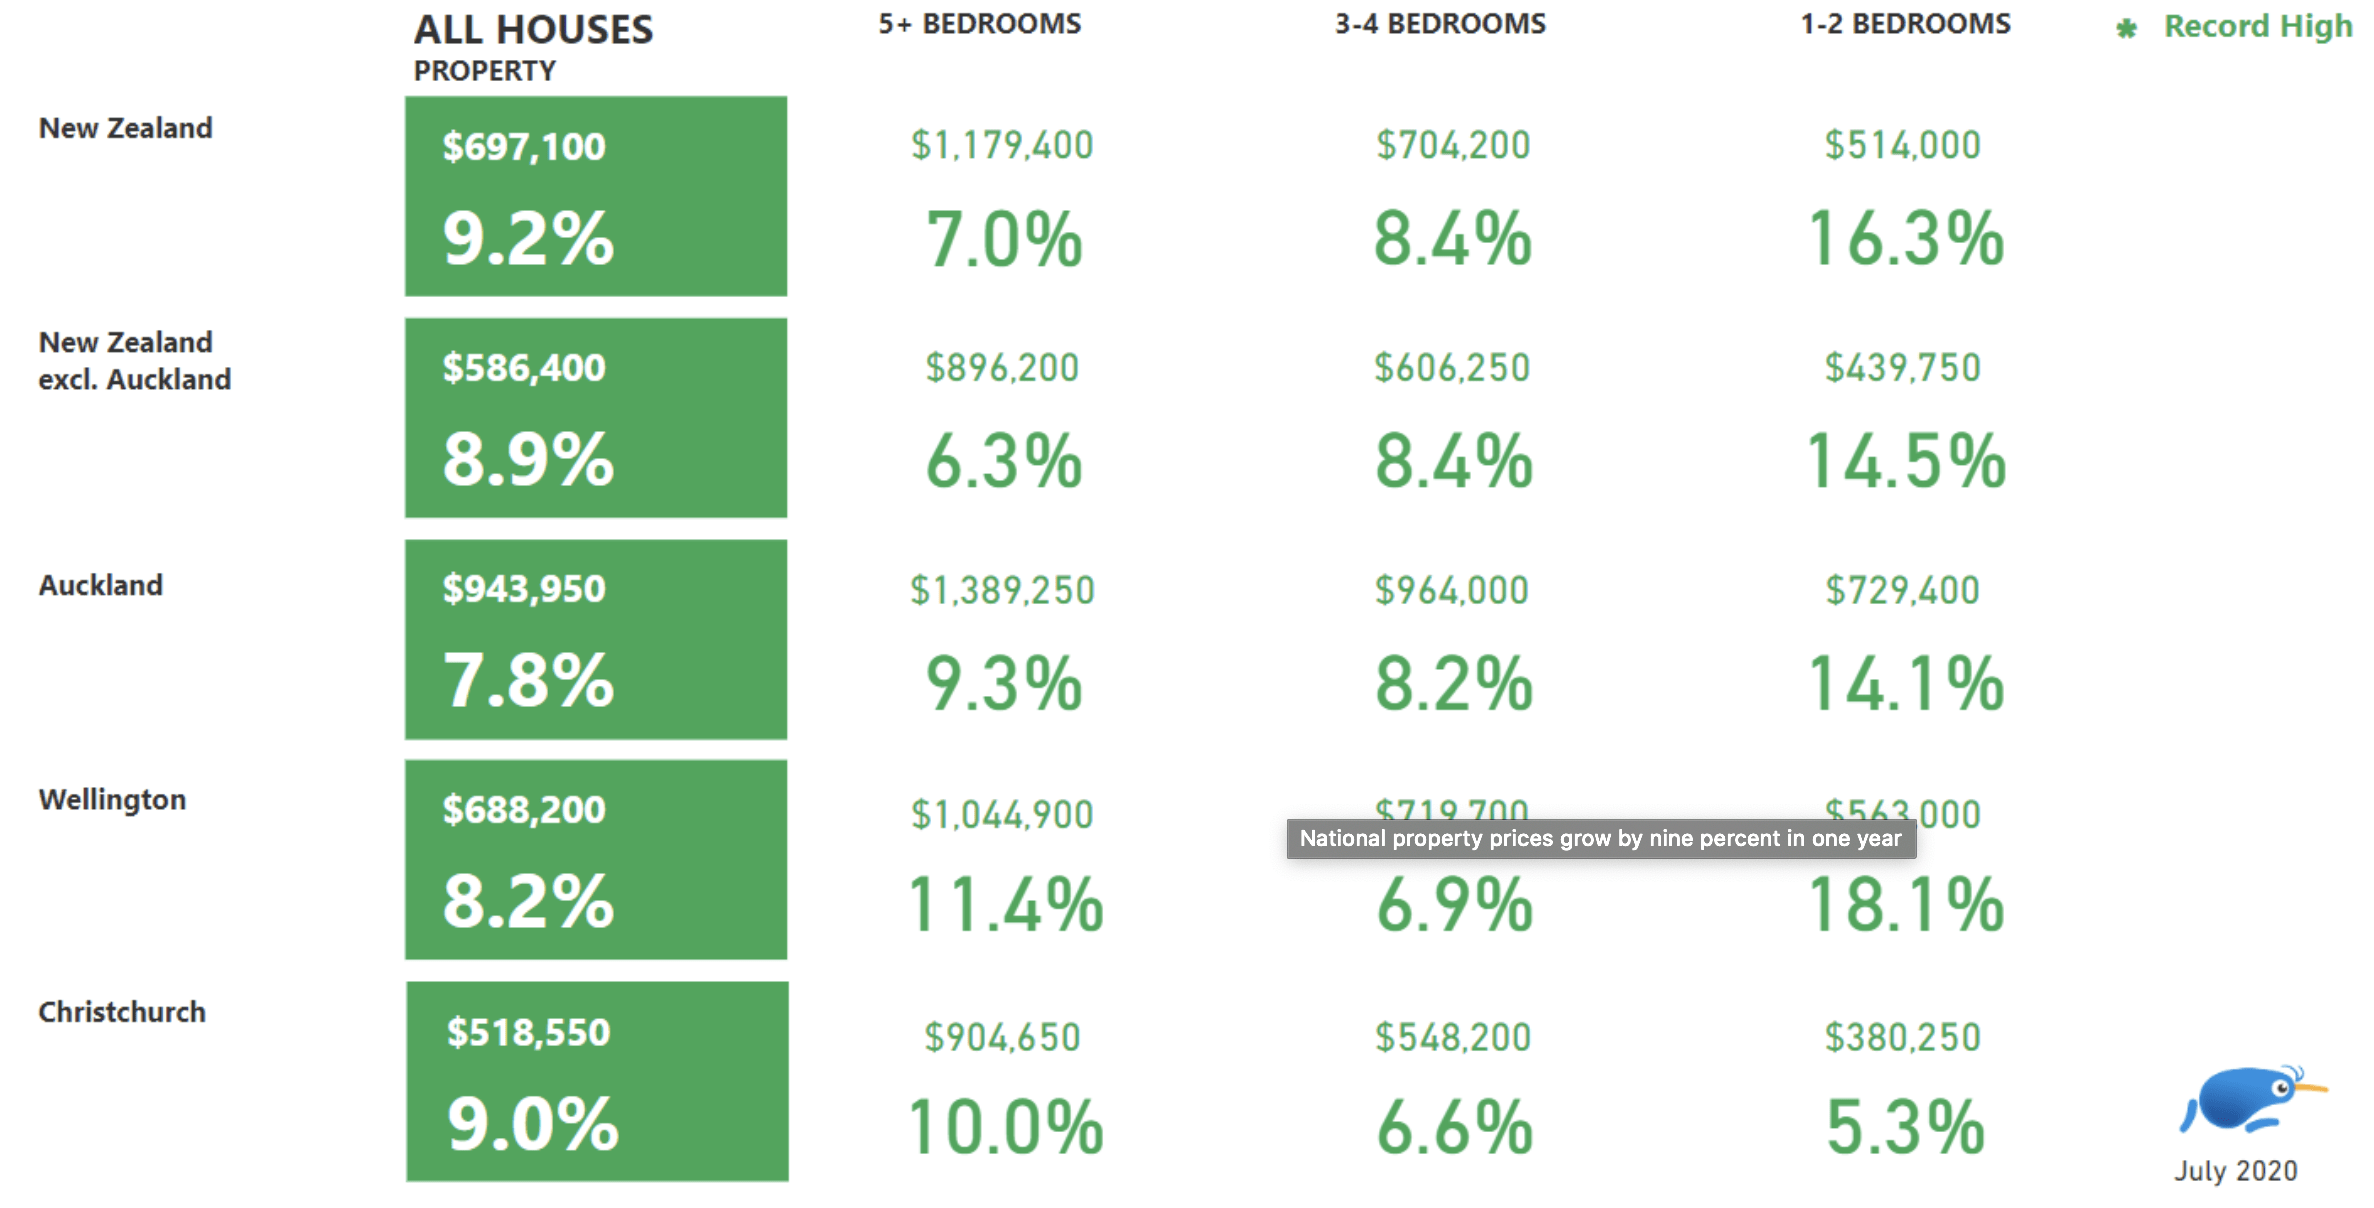
Prior to entering Alert Level 3, Trade Me Property spokesperson Aaron Clancy said property price growth in the Super City was showing no signs of slowing down.
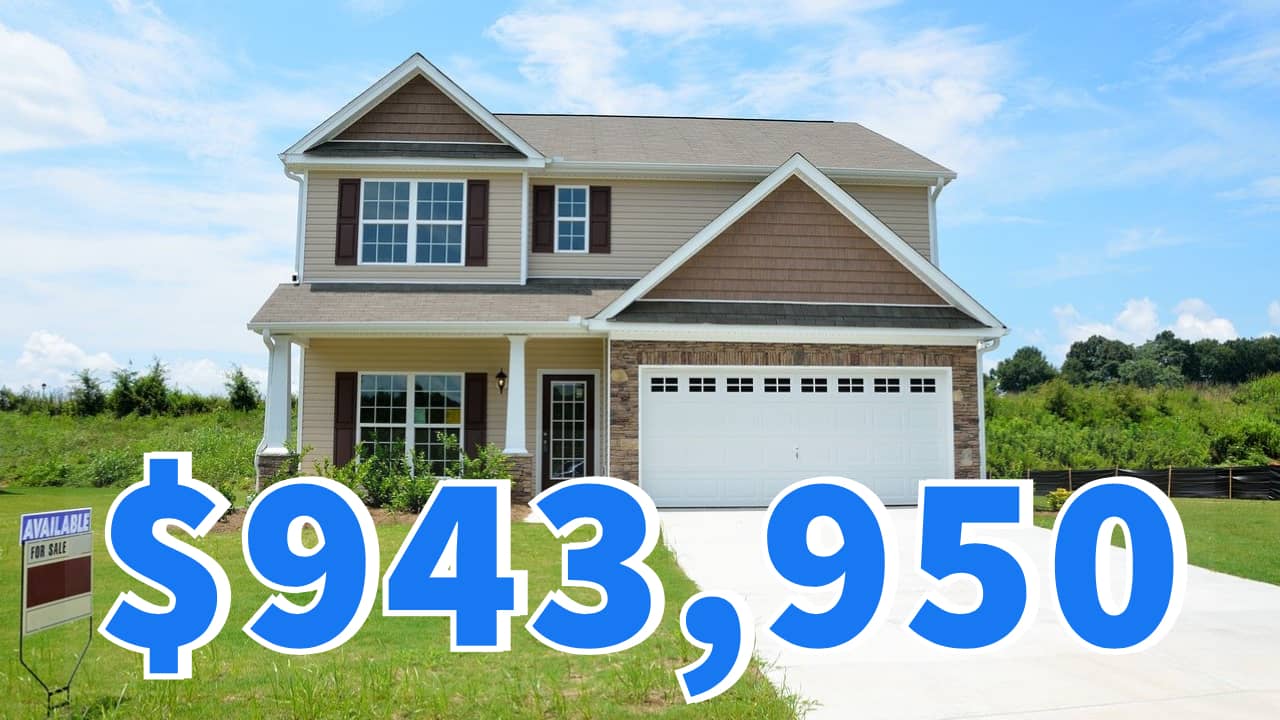
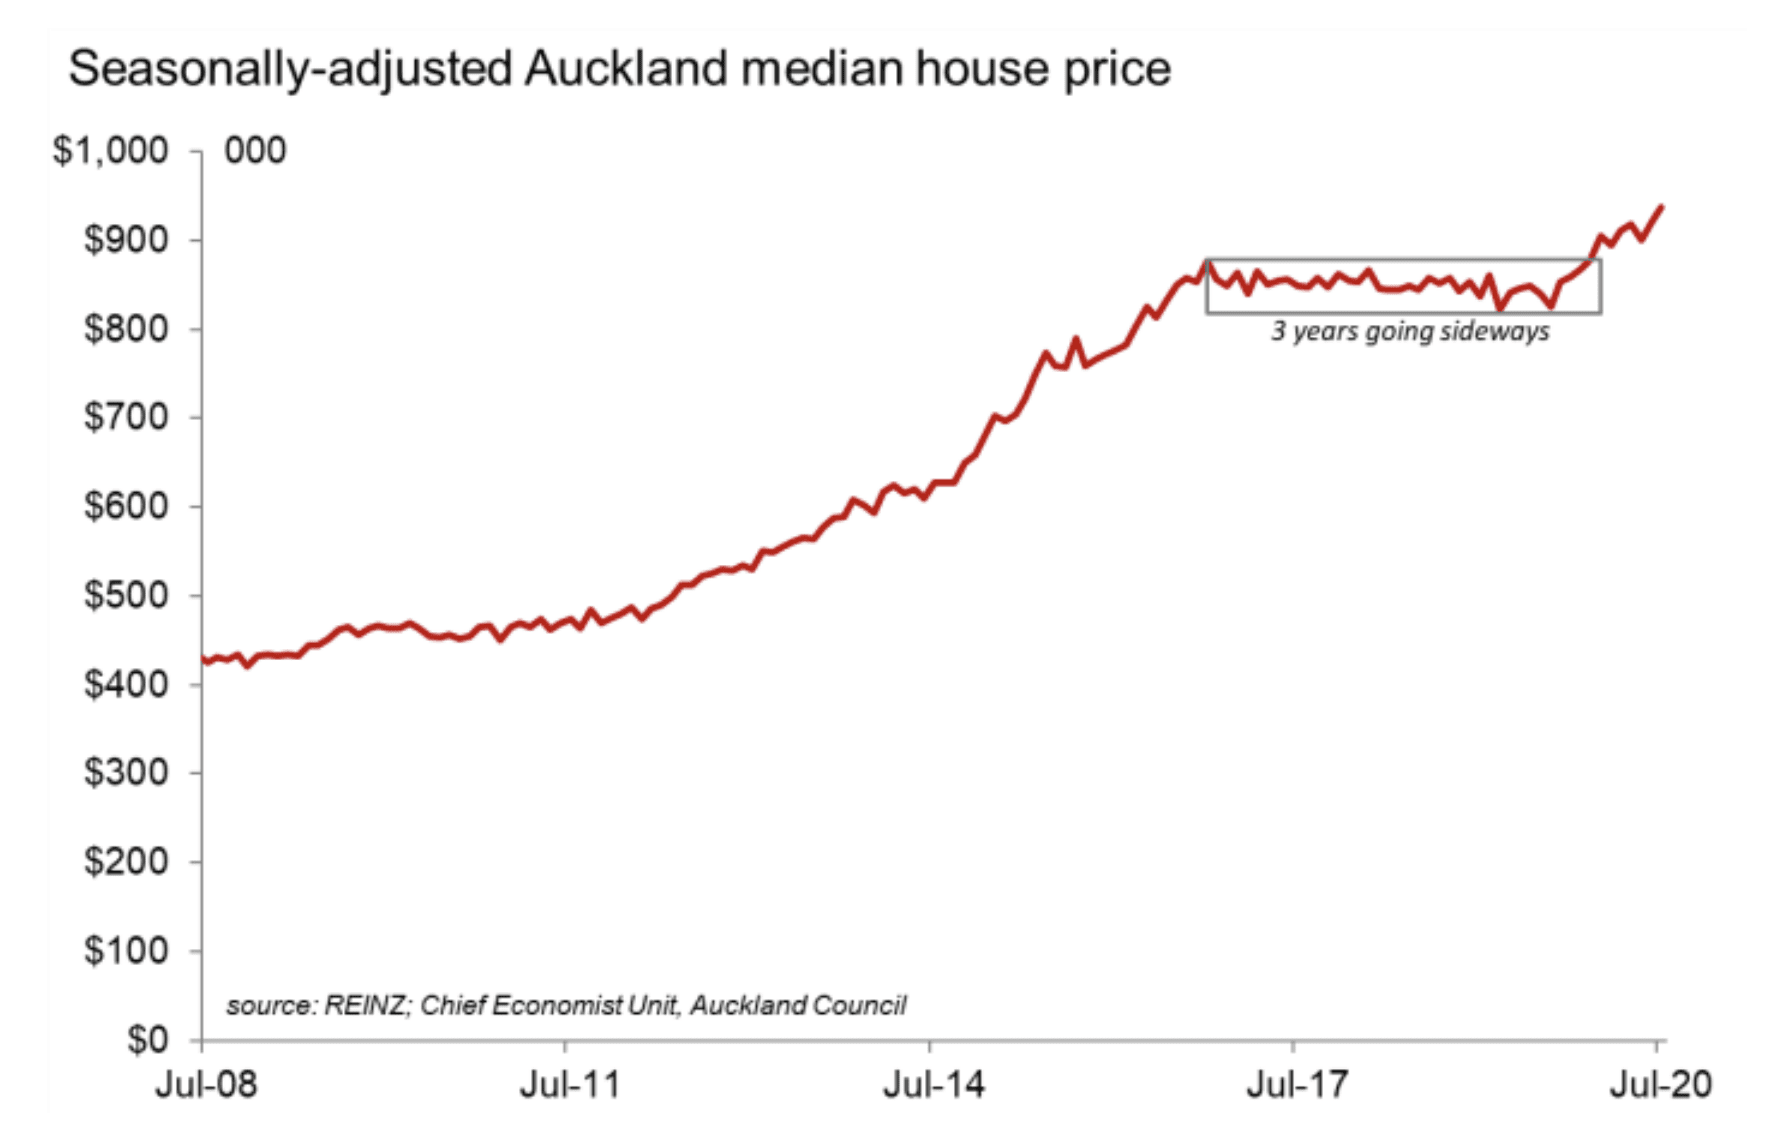
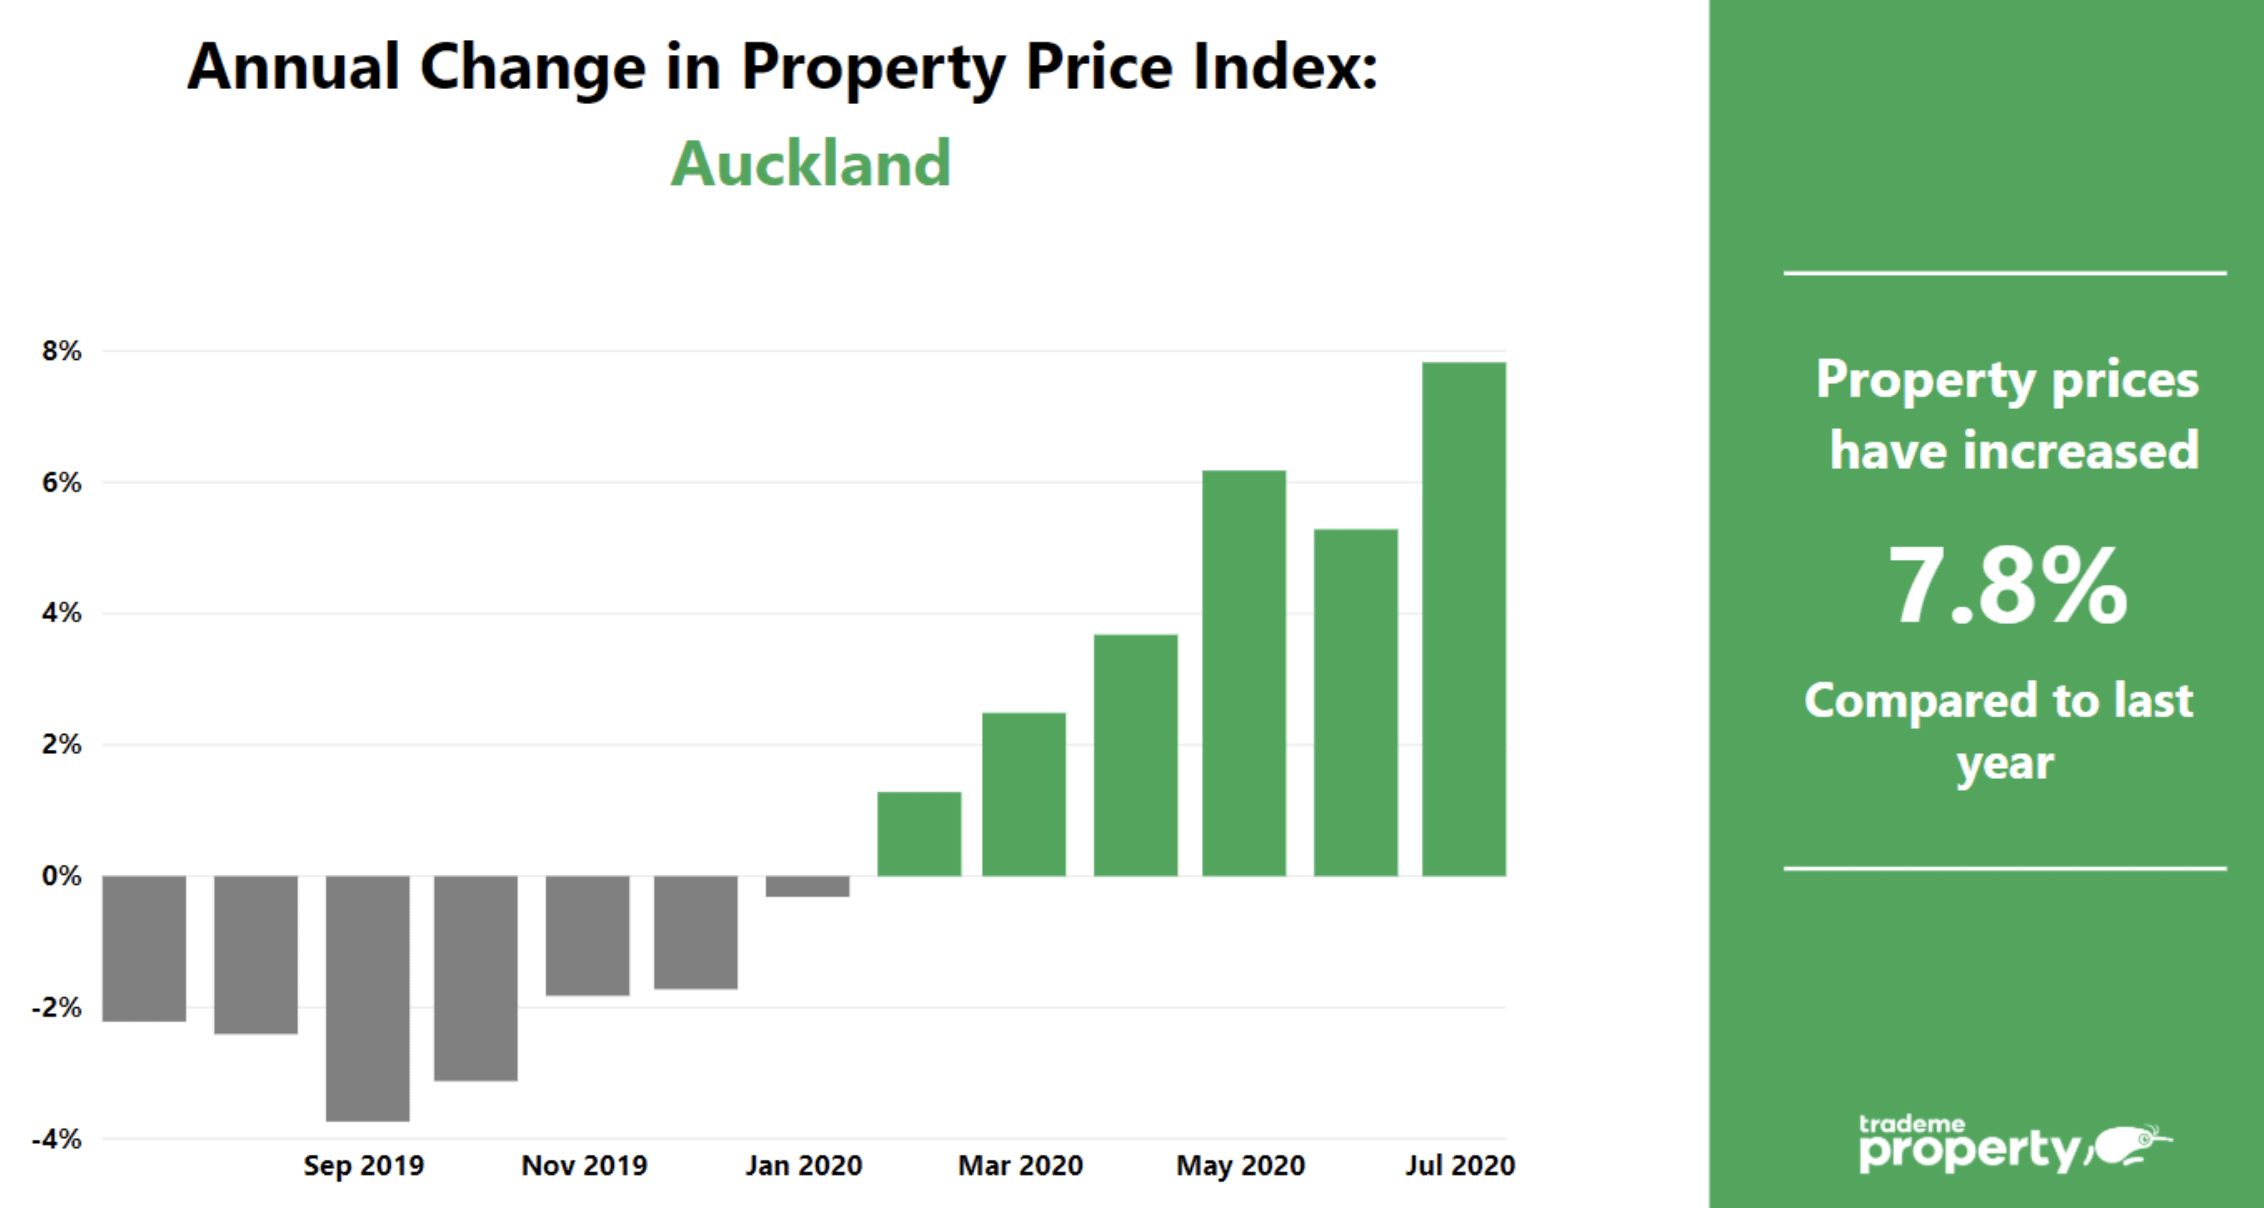
“The July asking price in the Auckland region was up by 7.8% when compared with July last year, sitting at $943,950.
In Auckland City, the average asking price was $1,088,250 – a 9% increase on the same month in 2019.”
Mr Clancy said the region saw the same increase in demand and slow supply as the rest of the country.
“The total number of properties available for sale in the Auckland region was down by 5% when compared to July last year, while listing views were up by 23%.”
“Time will tell whether prices in the region continue to follow nationwide price trends, or the regional lockdown results in unique property market activity patterns in Auckland.
Obviously, we expect to see a slightly different story in Auckland during August, with level 3 restricting movement, but hopefully the market will bounce back quickly once again when the region enters lower alert levels.
Small House Prices See Big Growth
All house types across New Zealand experienced year-on-year growth in July, but no new highs were reached.
“Small house (1-2 bedroom) prices saw big year-on-year growth across the country, up by 14% in both Auckland.”
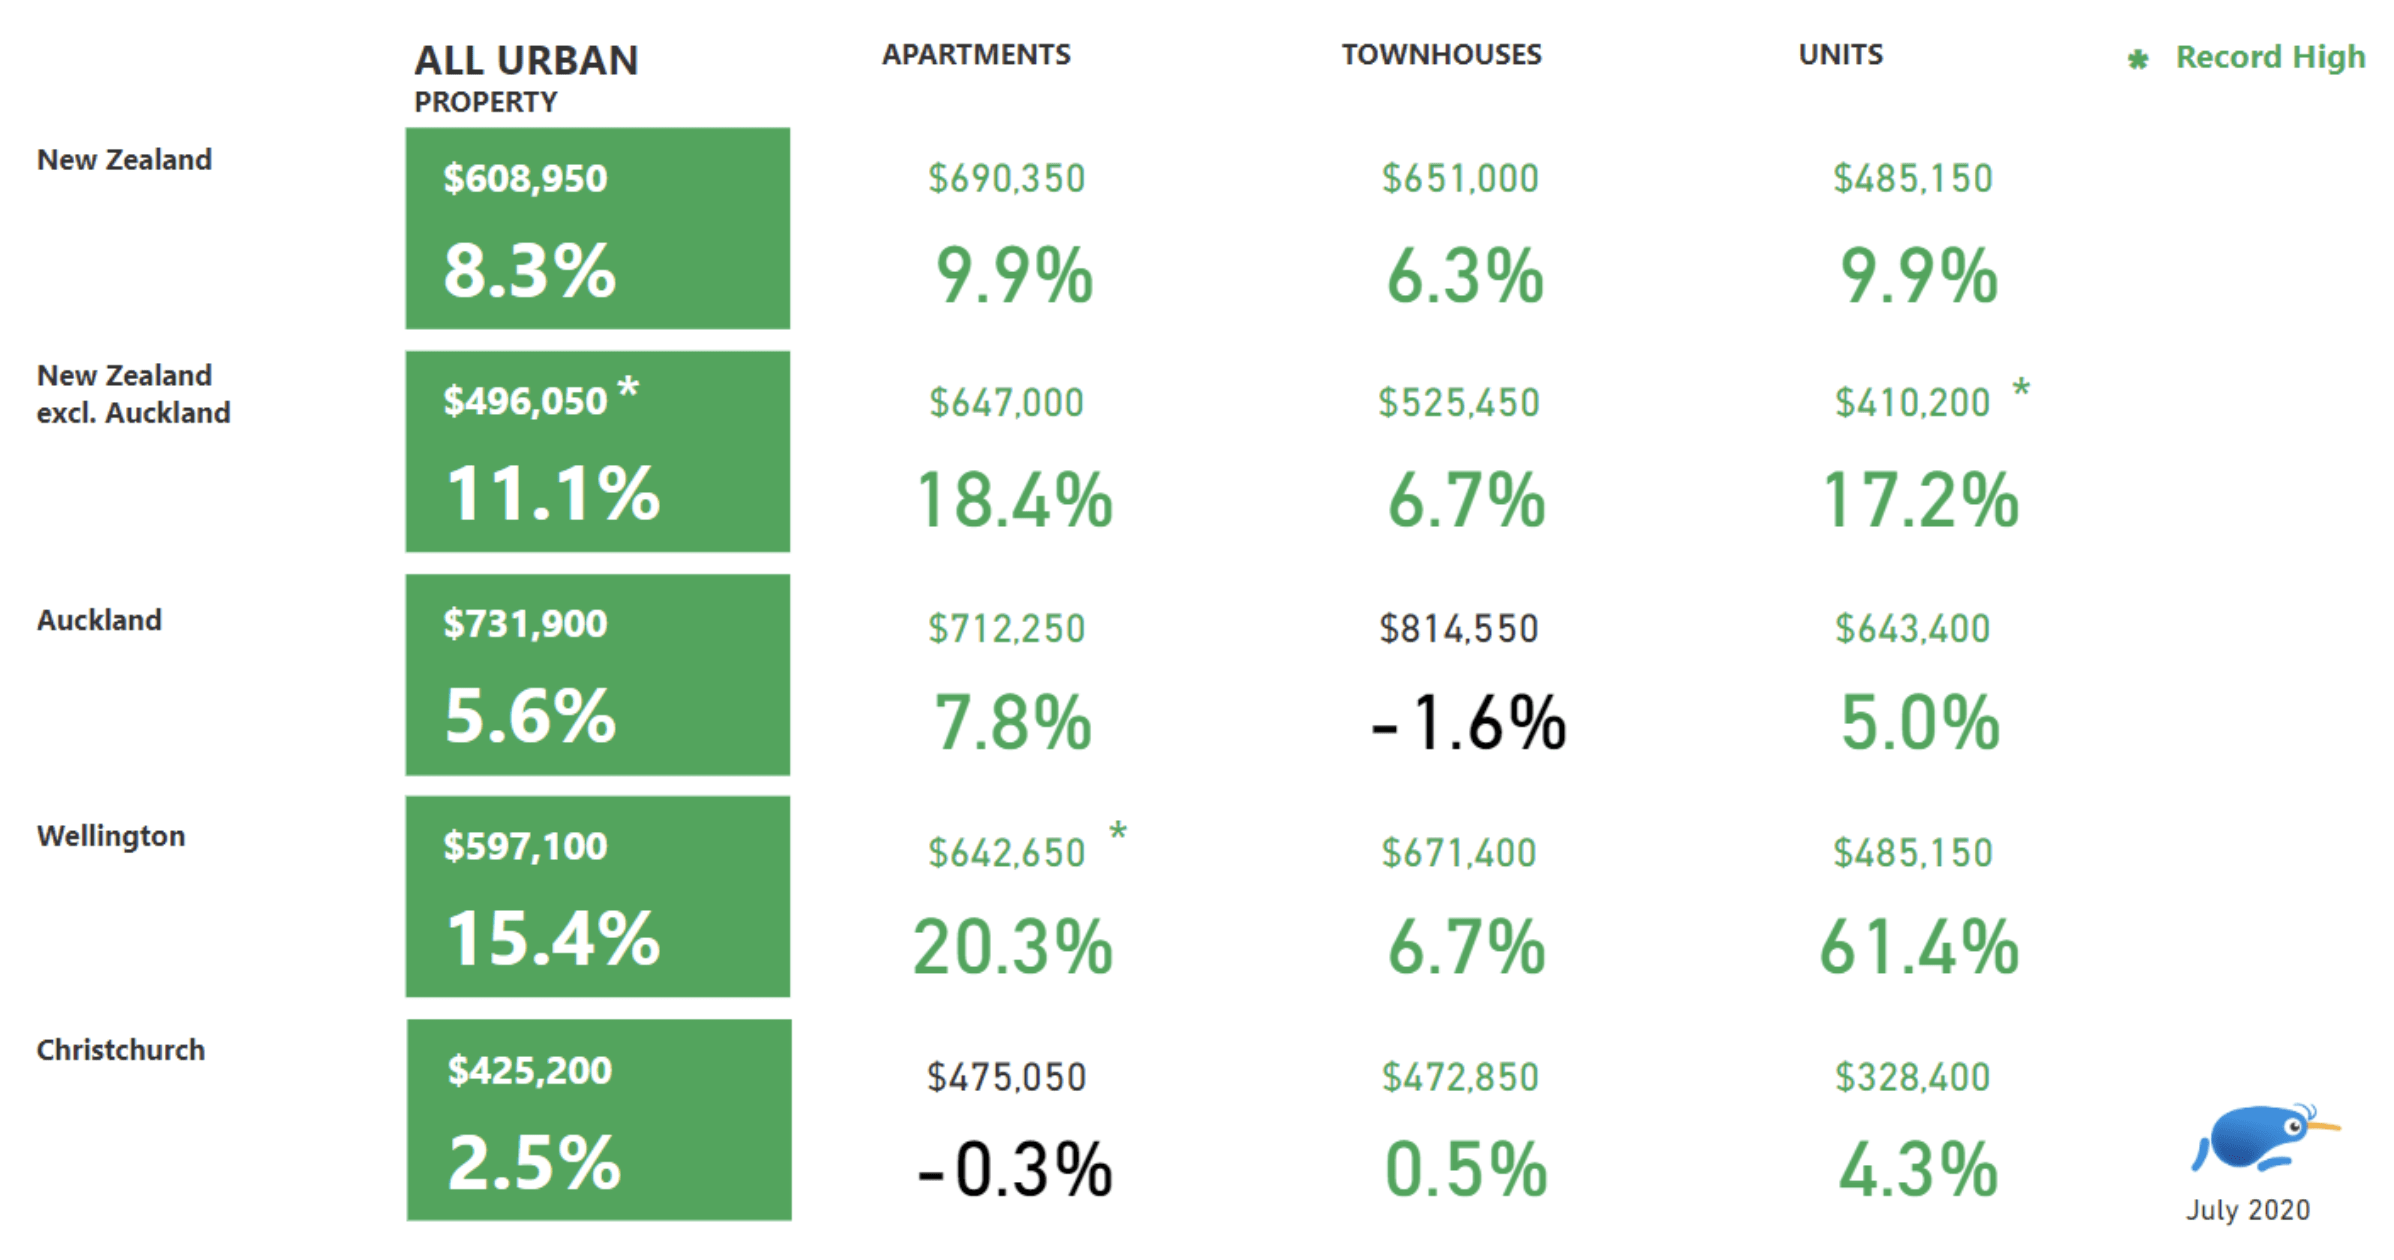
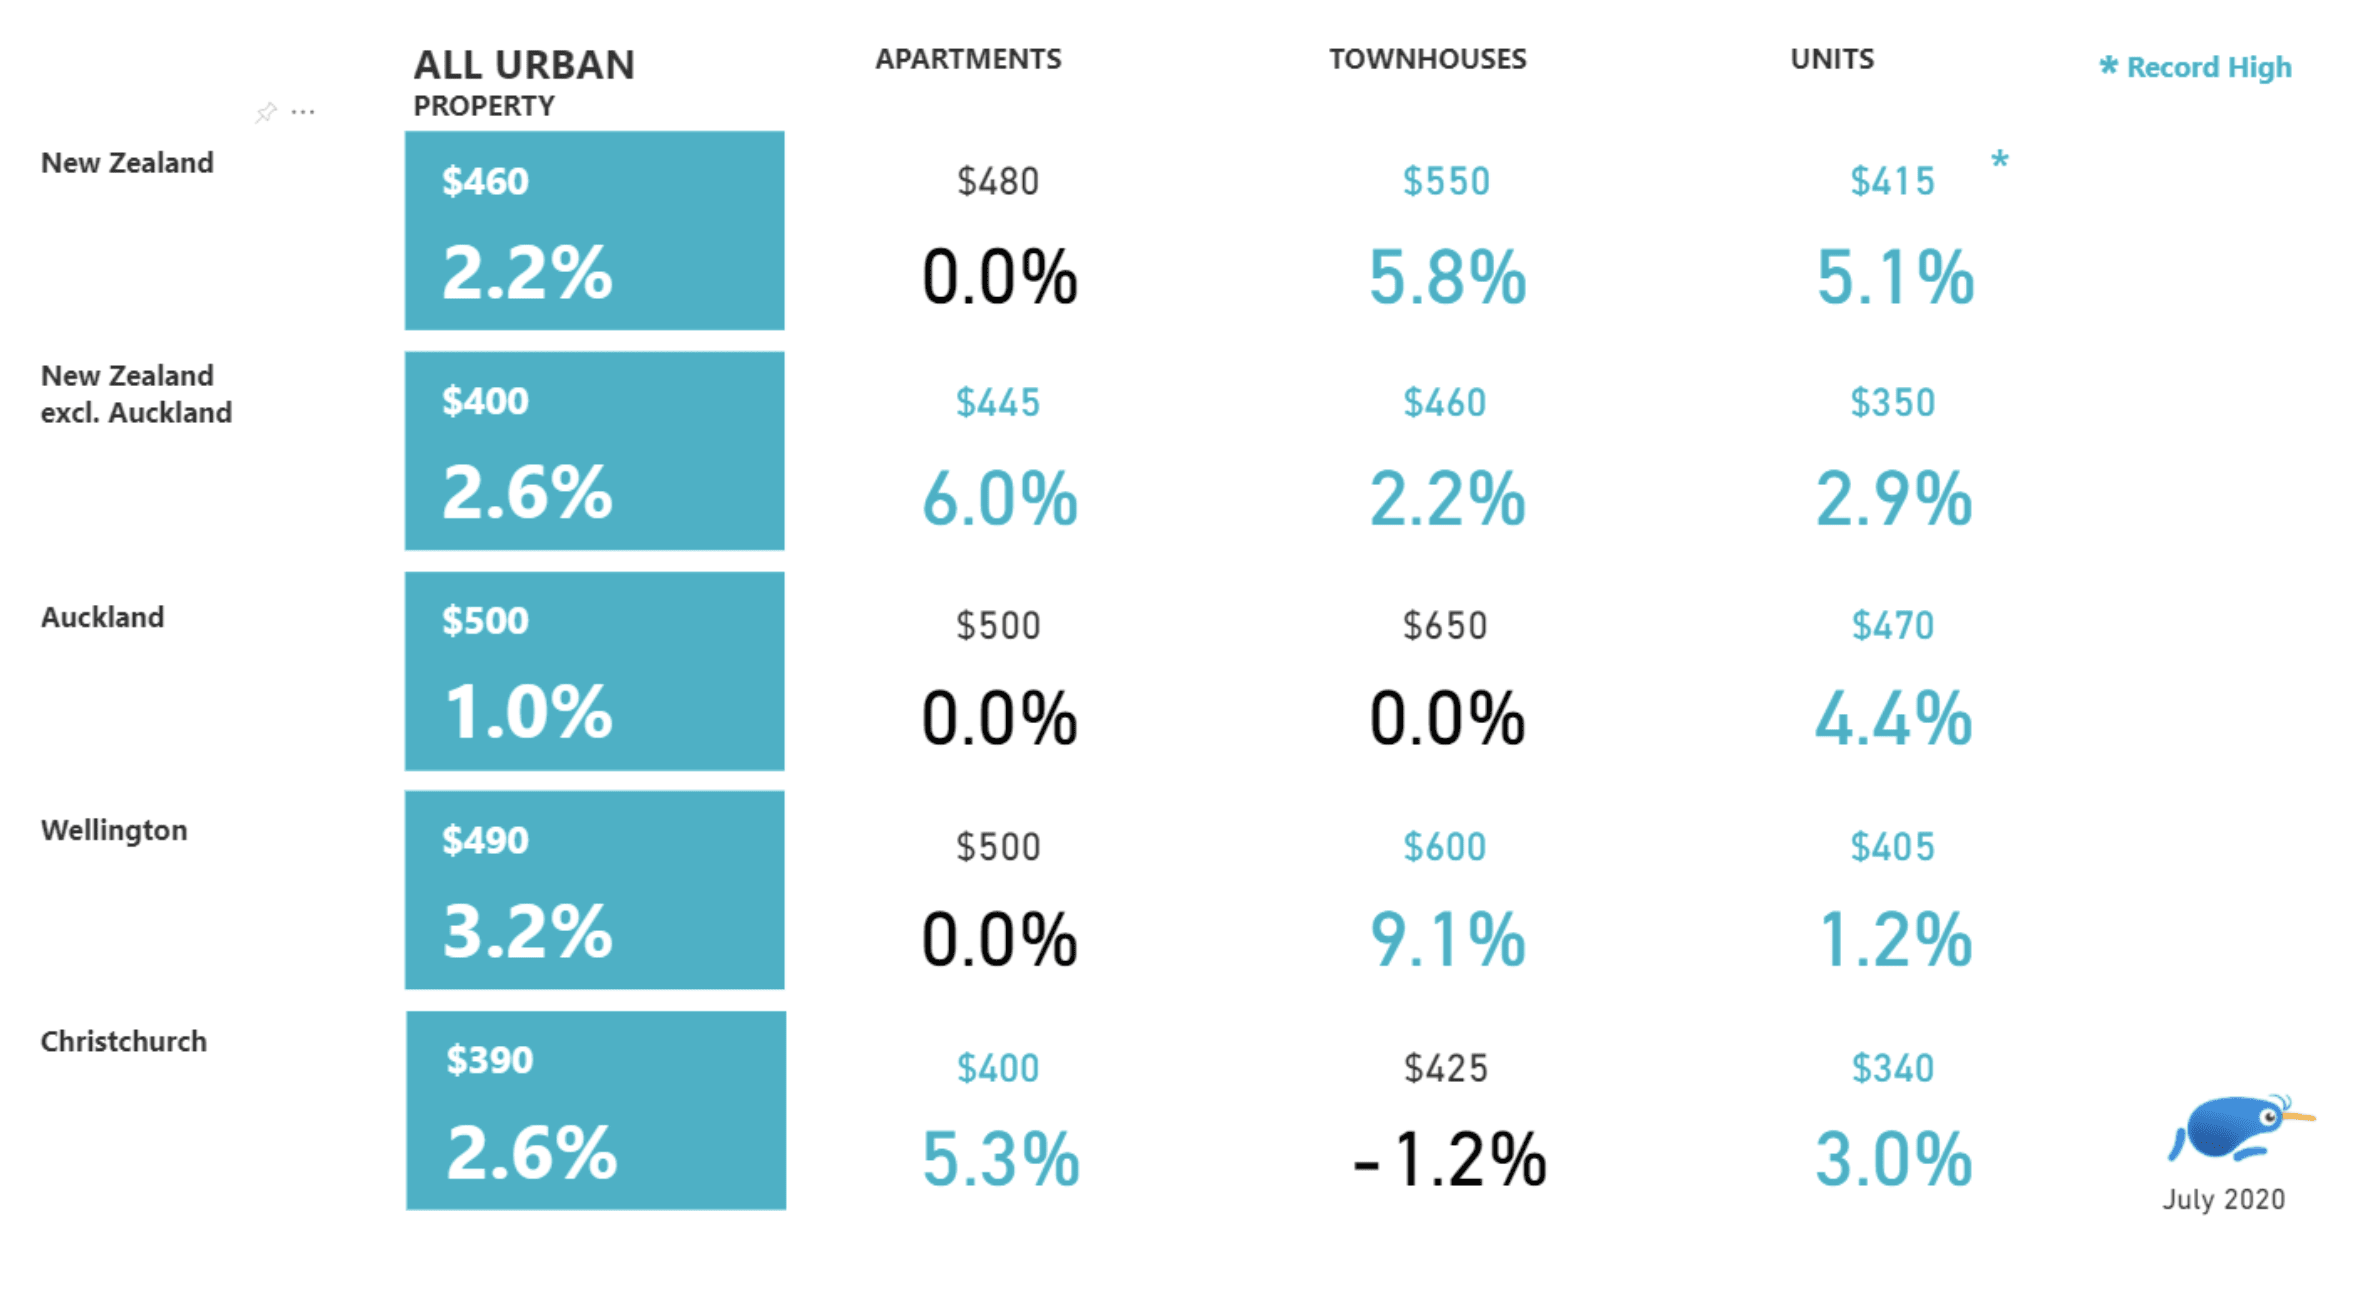
Apartments, townhouses and units all saw price increases in July across the country.
If We Are in a So-Called Recession Why Are House Prices So High, Buoyant?
Independent economist Tony Alexander listed some of the reasons:.
• A pre-Lockdown 1 net migration boom.
• Record low interest rates heading lower and expected to stay down for years.
• Knowledge of housing shortages.
• Removal of LVRs and first home buyer hopes of banks accepting smaller deposits.
• Gearing up of money no longer to be spent on offshore travel.
• Most people do not suffer income loss just because we are in (have already had and exited) a recession.
• A structural shift forward in time of home purchase plans.
• Most (not all) people losing their jobs because of the fight against Covid-19 are in the services sector on low and variable wages.
They tend not to be home owners. Assisted by low interest rates I anticipate average house prices rising from early-2021 if not sooner.
Rents Show No Growth for the First Time in Three Years
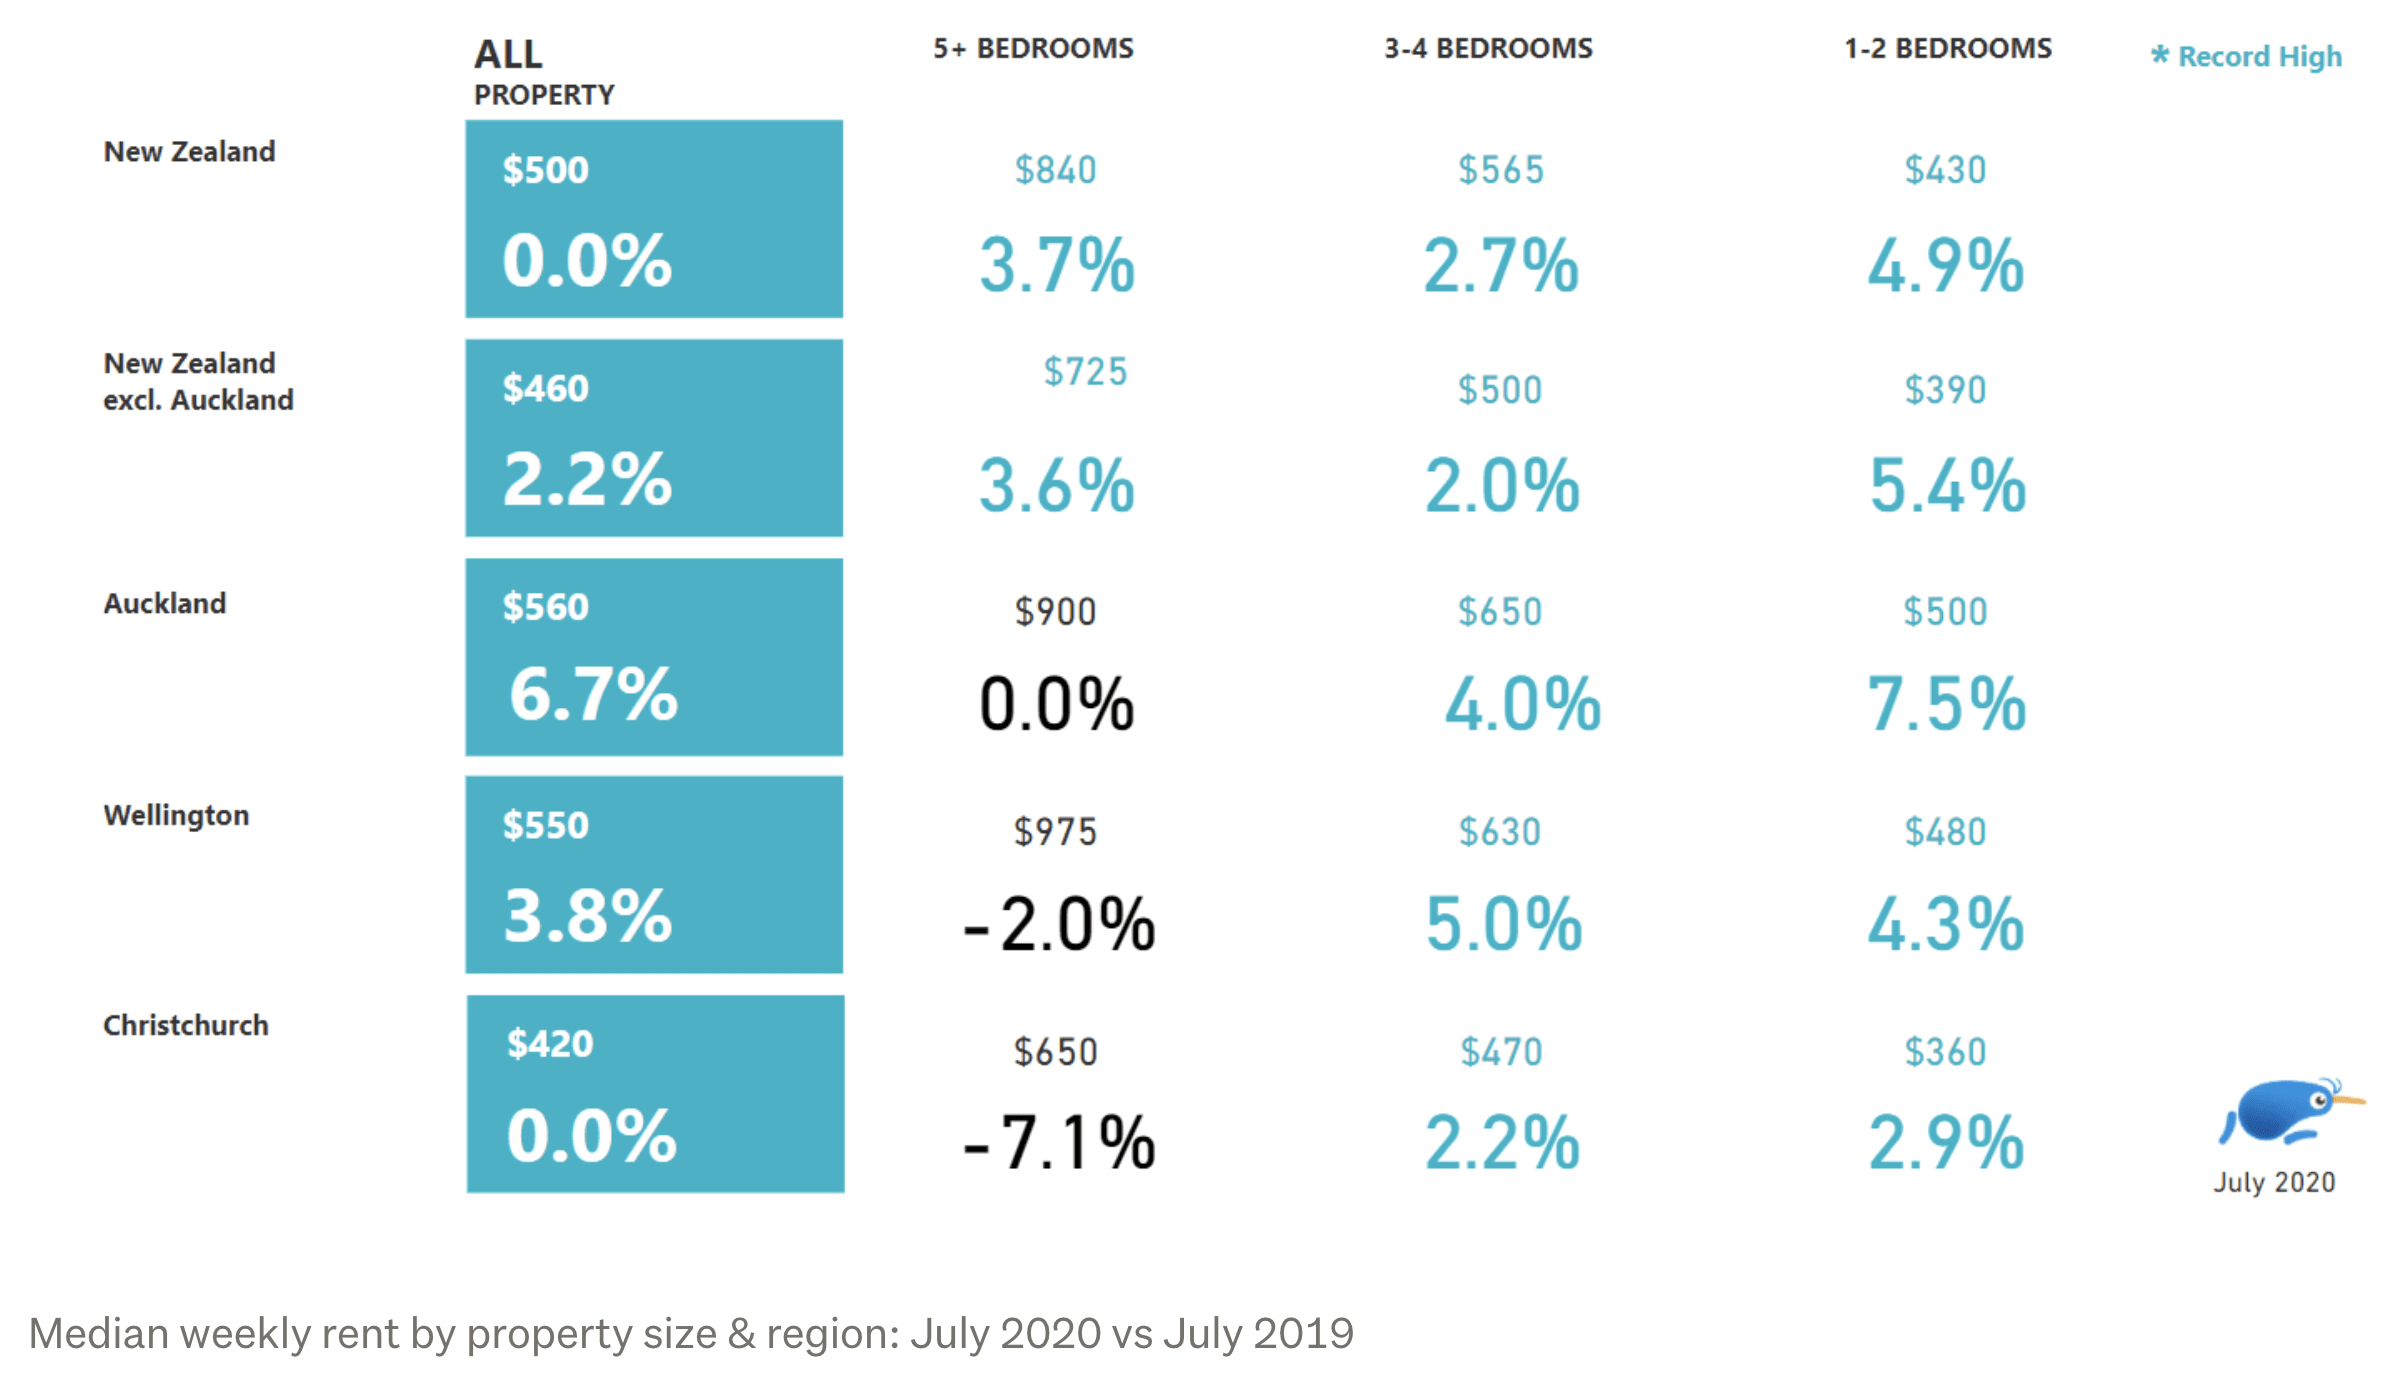
When compared to July last year, the median weekly rent in the Auckland region remained flat year-on-year at $560 last month.
In the Auckland region, the districts with the highest median weekly rents were Waiheke Island ($670), North Shore City ($610), and Manukau City and Rodney third equal ($570).
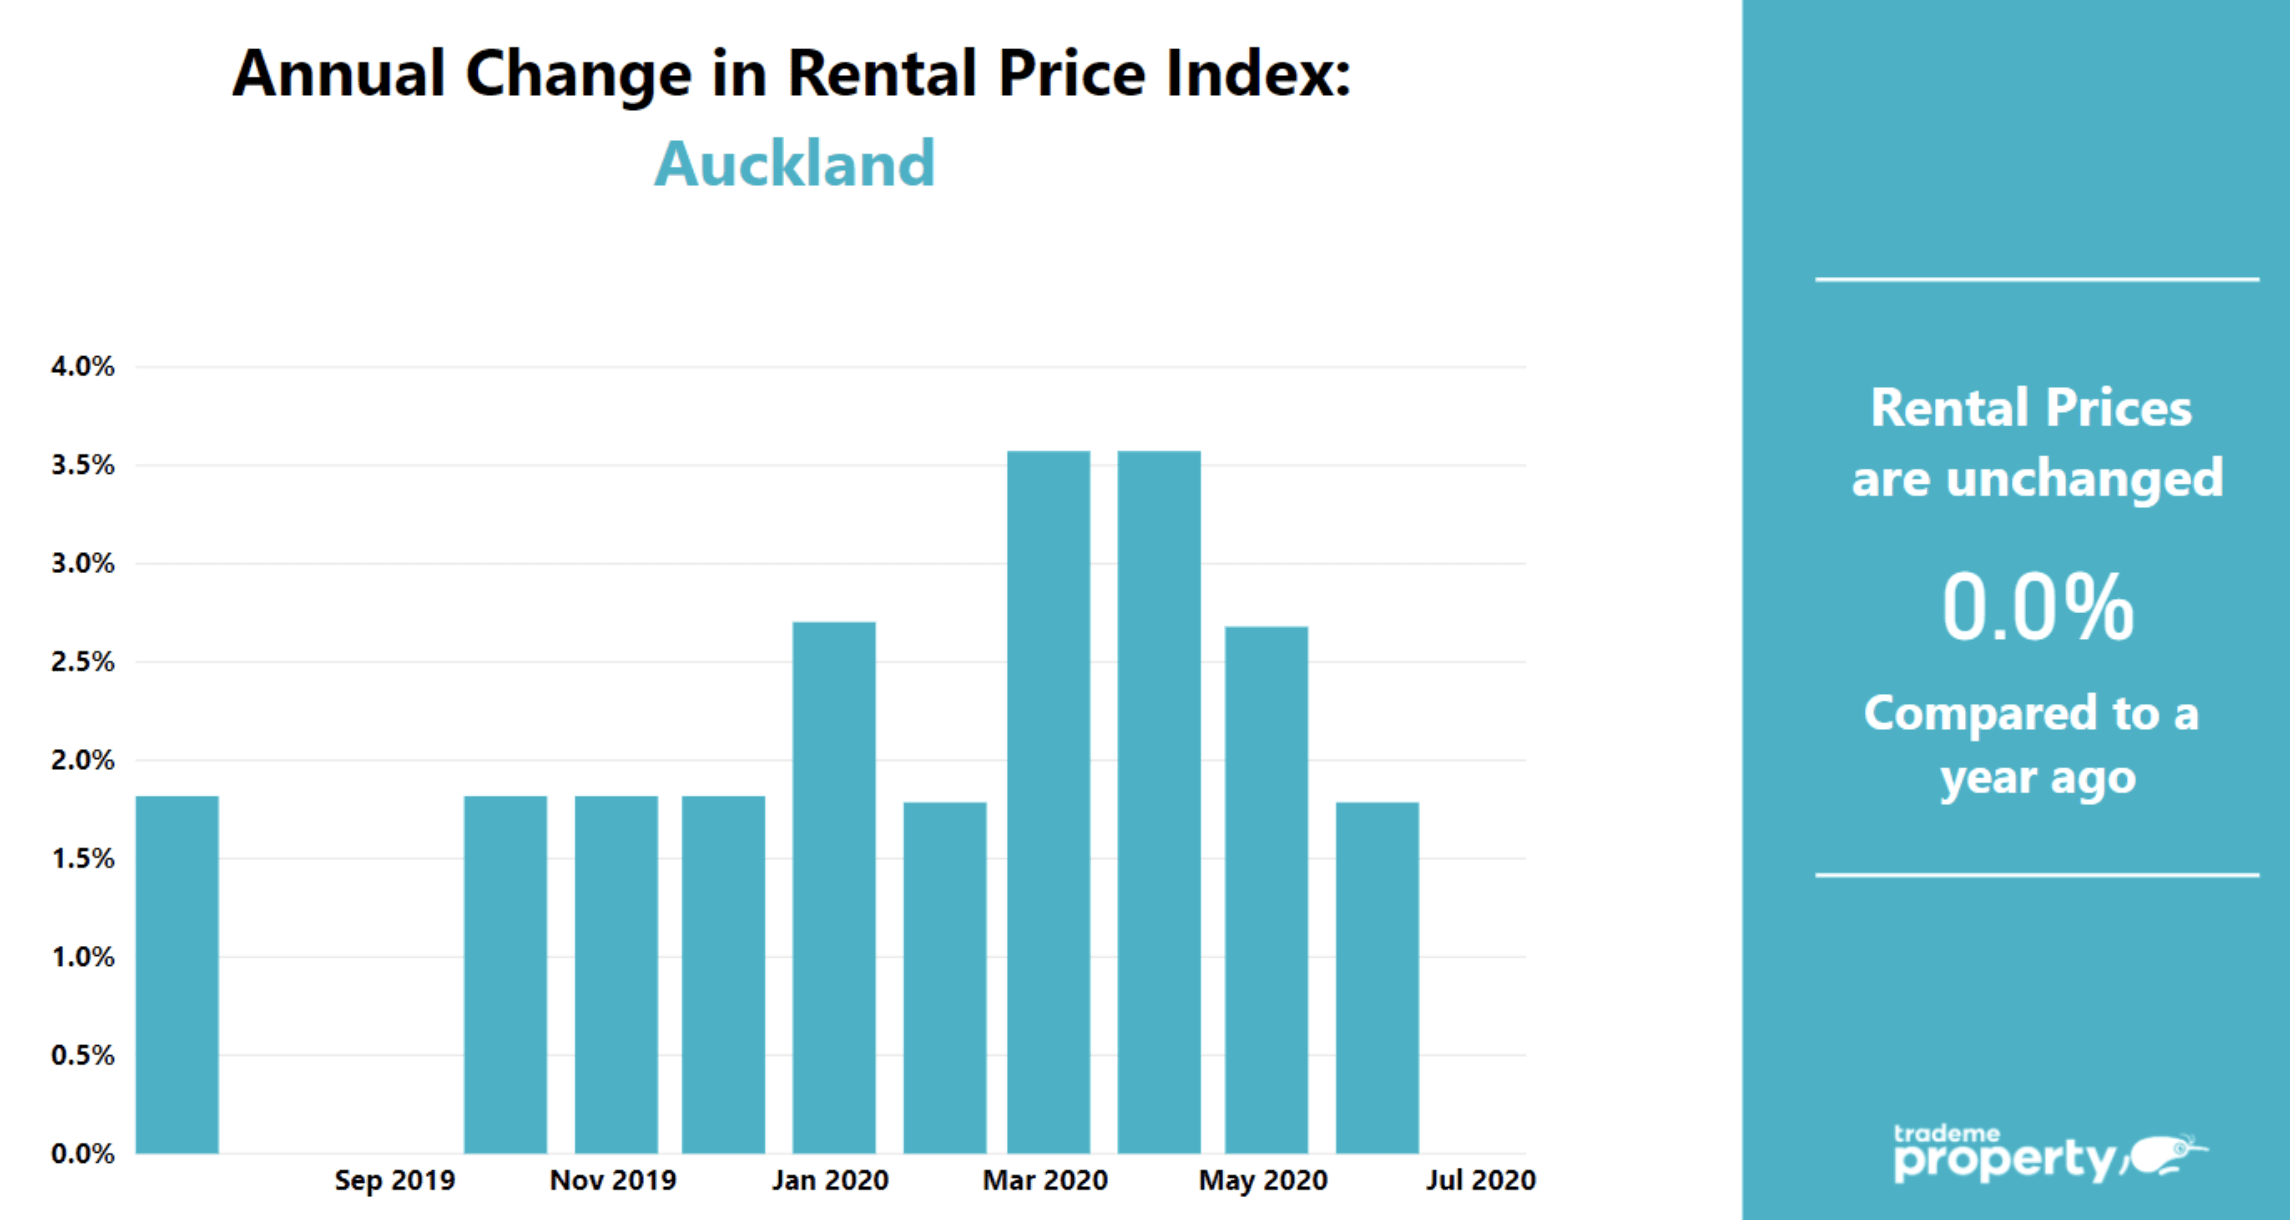
Overall demand in the region was up 10 per cent year-on-year, while supply was flat.
The most popular rental of the month was a two-bedroom spot on Cambridge Terrace, Papatoetoe that received 104 enquiries in its first 48 hours onsite.
Mr Clancy said large house rents had shown the biggest decreases in July.
Last month’s weekly median rent for large houses (5+ bedrooms) in the Auckland region was flat in July 2019.
Source: ANZ, TradeMe, Tony Alexander
What do you think about it? Tag me on your favourite social media (Facebook / Instagram / LinkedIn / Twitter).
P.S. I research and interview economists, NZ investors and profitable companies to find tools & tactics that you can use to achieve financial freedom.
➔ Join my private newsletter to be the first one to learn insider tips! Here are examples of what you’ll get. It’s FREE. You can unsubscribe at any time. I treat your email as my top secret.
IMPORTANT: This article is of general nature only and readers should obtain advice specific to their circumstances from professional advisers.